Cricket Analytics Data Pipeline
CAP is an end-to-end cricket analytics platform built on Cricsheet ball-by-ball data
0.0
0 reviews•
Snowflake·
Apache Airflow·
Python·
SQL·
dbt
CAP (Cricket Analytics Platform) is an end-to-end analytics platform built on ball-by-ball cricket data from Cricsheet. It demonstrates how semi-structured JSON event data can be ingested, modeled, or...
About this project
CAP (Cricket Analytics Platform) is an end-to-end analytics platform built on ball-by-ball cricket data from Cricsheet. It demonstrates how semi-structured JSON event data can be ingested, modeled, orchestrated, and served using a modern, warehouse-native analytics stack.Although the domain is cricket, CAP is designed as a general reference architecture for handling complex JSON data at scale, applicable to use cases such as clickstream analytics, IoT telemetry, and financial events.
Data source: Cricsheet — https://cricsheet.org/
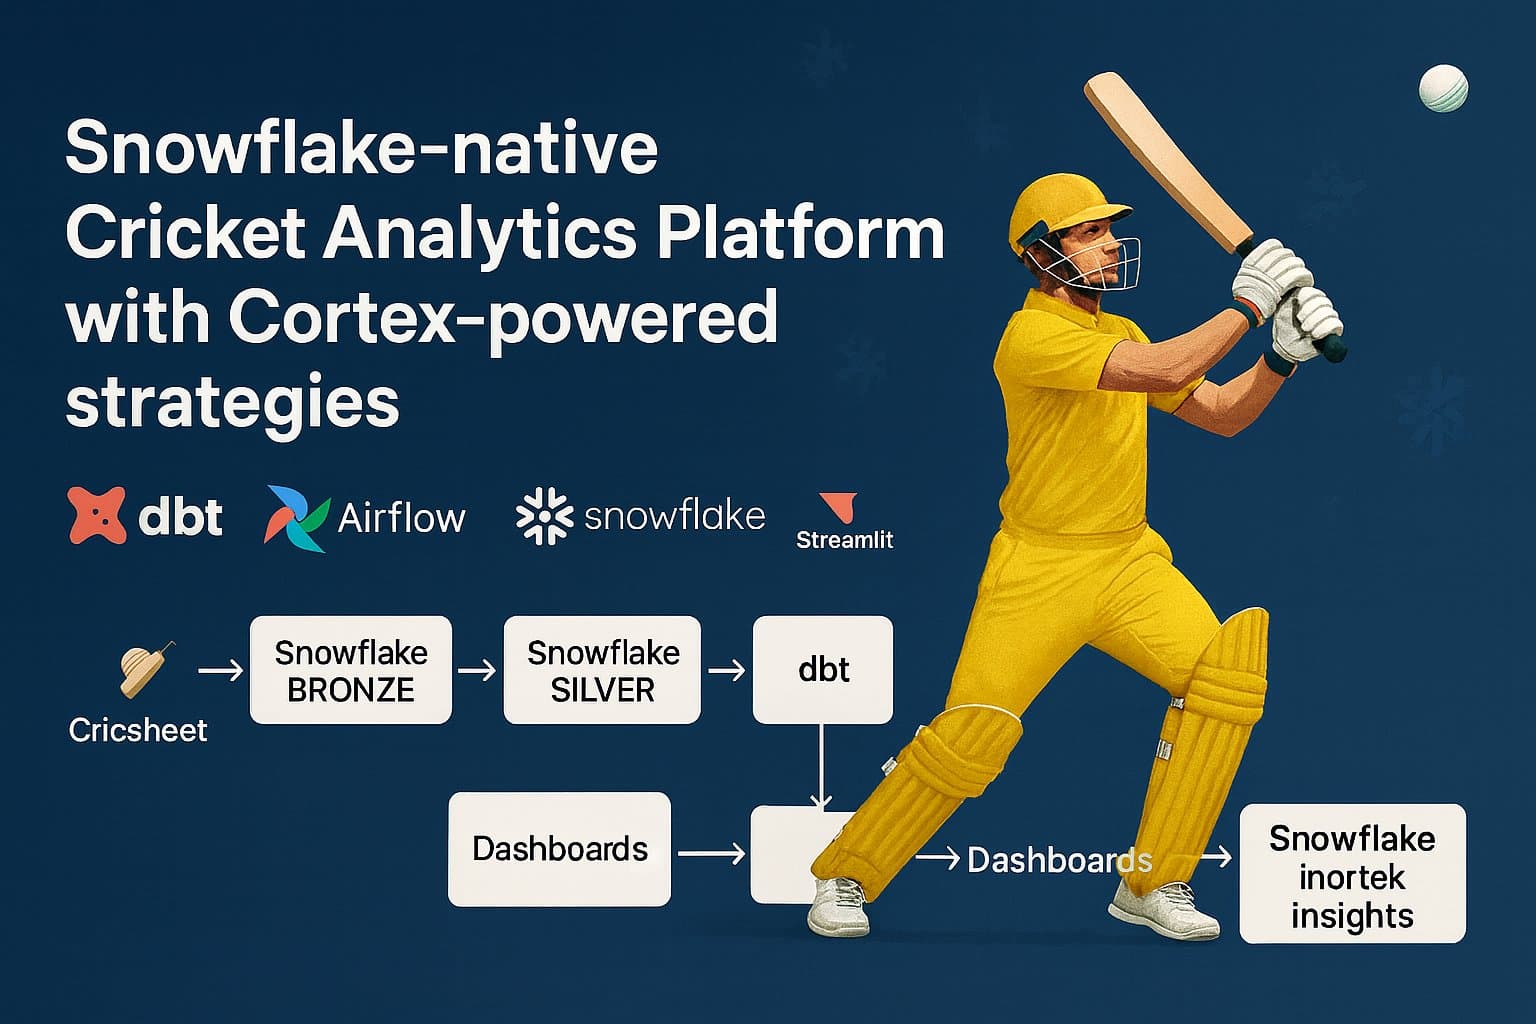
Platform Flow
Nested JSON match files are ingested into Snowflake without modification to preserve raw data. dbt transforms progressively structure this data into analytics-ready models, while Apache Airflow orchestrates the pipeline end to end. Outputs are consumed through Snowflake-native dashboards and applications.
Data Layers
Bronze stores raw match JSON losslessly with minimal metadata for lineage.
Silver flattens and structures the data into domain tables for matches and deliveries.
Gold provides a compact, delivery-centric semantic model enriched with match context.
Reporting builds analytics-ready datasets for downstream consumption.
Orchestration and Delivery
Airflow orchestrates dbt transformations using Cosmos, keeping dependencies declarative and observable. dbt remains the single source of truth for transformations, testing, and lineage. Insights are delivered via Streamlit apps running natively in Snowflake.
AI Strategy Layer
An AI layer uses Snowflake Cortex to generate explainable, data-grounded match strategy summaries. Outputs are fully traceable to underlying analytics.
Reporting (Analytics Marts)
Cricket-specific metrics such as par scores, phase-wise run rates, player summaries, team trends, and matchups are computed for direct consumption by dashboards and apps.